Data Journalism Challenge Solution
On November 3 Platform Linked Data Netherlands (PLDN) organized a UX Linked Data Challenge at the CGI Spark Innovation Center in Rotterdam. Five challenges and six tools were presented for the participants to work with. Teams were assembled and the activities started to develop different solutions for a number of challenges. The results of these activities were presented on December 2 during the PLDN Linked Data Seminar at Waternet in Amsterdam. The audience in Amsterdam was impressed by the results of the challenge teams and chose the Data Journalism team as their winner.
The Data Journalism team is a multi-disciplinary team with members from journalistic, academic, government and business organizations. It is a very good example of how open innovation can work well if experts from different domains join forces to work on an innovative solution. The goal of this team was to show the added value of Linked Data for Data Journalism in general and to create a solution that would support Data Journalism activities interactively in order to do deep, fact-based and unbiased investigations using data from multiple sources and in different formats.
Drone example
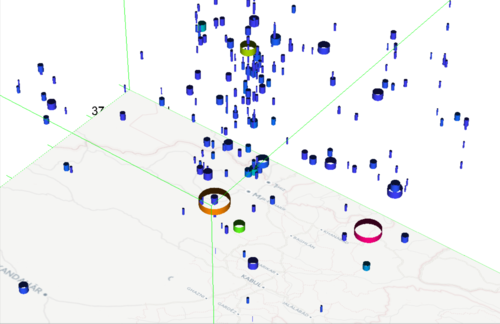
Starting point for the Data Journalism team were two datasets about drone strikes in Pakistan and Yemen. These datasets were converted to Linked Data and enriched with coordinate data and links to other data sources. It was a challenge to include good coordinate data in the datasets, since most drone strikes are executed in the mountains of Pakistan and Yemen with little or no villages or cities you can refer to. Despite this additional challenge, the team managed to find enough coordinates to do a first map-based 3D visualization, where data is projected on a timeline.
Space-Time Cube example
A second result for this Data Journalism challenge is a website in which you can load the available datasets and start doing further interactive investigations with this data. This is different from other solutions in this domain that present the data well as a static website or viewer, but which have no interactive means to do further investigation. Another nice feature of this web application is that it works completely serverless. You don’t need a server, everything is working on the client, which is a good application feature in cases where you have to work with sensitive data.
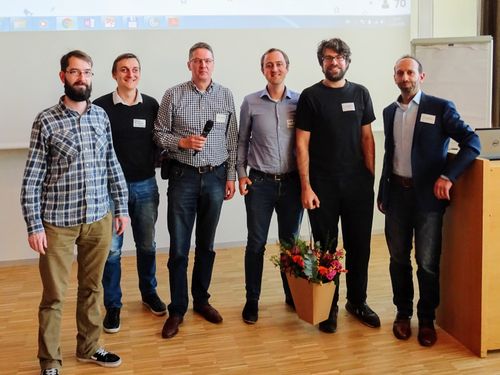
Data Journalism team with Rein van 't Veer, Stanislav Ronzhin, Pieter van Everdingen, Sam Ubels, Wouter Beek and Rob Lemmens
Expert users can investigate available linked data sets by creating transparent queries and using generic visualization components to find patterns, dependencies and more fact-based evidence that you cannot easily find with more traditional approaches (you can see it ‘on-the-fly’). And you can easily link to other data sources using linked data concepts in order to enrich and improve the user experience (e.g. other news articles from different news providers, and also to non-linked data sources). Working this way having an online toolkit for further investigation.
One of the next steps for this solution is to find funding for future development activities on this promising solution. Please contact Wouter Beek of the VU Amsterdam w.g.j.beek@vu.nl if you would like to discuss this further.


